
Clustering in Javascript
December 6, 2011
For various reasons, I’ve been wanting for years to implement hierarchical clustering with a dendrogram view in a web browser. Having finally got round to finishing it, here’s a little writeup.
What is clustering?
Take a bunch of objects which are all similar in some ways but different in others: all the plants in a garden, the books in a library, or the different types of cat. Your aim is to arrange these items in some kind of order or ‘tree’ hierarchy, based on how similar they are to each other.
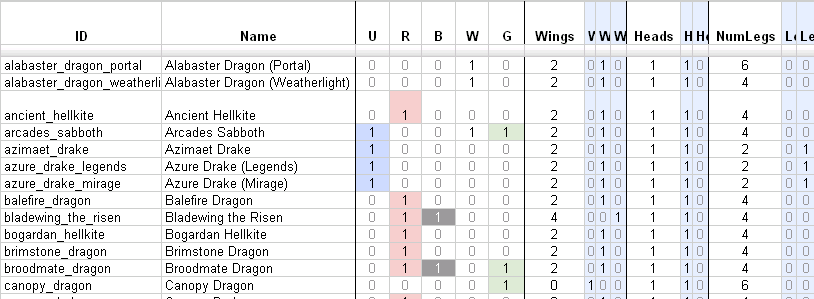
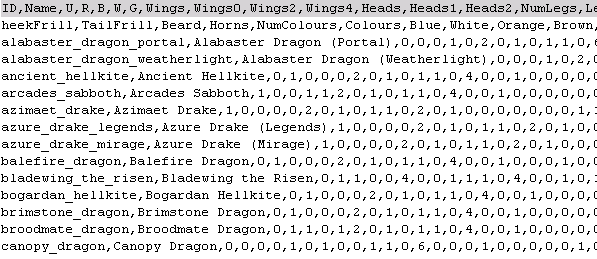
One of the first things to do is decide which features or characteristics of the items are important when you compare them against each other: how do you want to define ‘similar’? E.g. for books, do you care about the number of pages, whether it is paperback or hardback, the subject matter, or its Amazon rating?
Once you’ve figured out the features of interest, you then need to derive a numerical figure for how different one item is from another, based on those features. Once you have a measure of this ‘distance’ between the items, you can easily work out which items are ‘closest’ to each other (i.e. most similar).
Building up a tree structure of items is then quite easy: for example, you can look for the two most similar items in your set, and group them together to make a cluster, then look again over the whole set (which now includes this cluster) to find the two most similar, and group them together into another cluster… and repeat until you have eventually grouped the whole lot into a tree with a single root. The point at which a branch occurs corresponds to the distance between the two clusters.
There are various well-established approaches for calculating distances and constructing the cluster tree, which if I were a mathematician I would probably expound upon at great length. However at this point I think it’s time to just give it a try…
Clustering and displaying some data

Launch the clusterer: open it in a new window to give yourself some space to play with. Select some of the datasets provided, or try loading your own if you’re feeling adventurous.
Better with Pictures
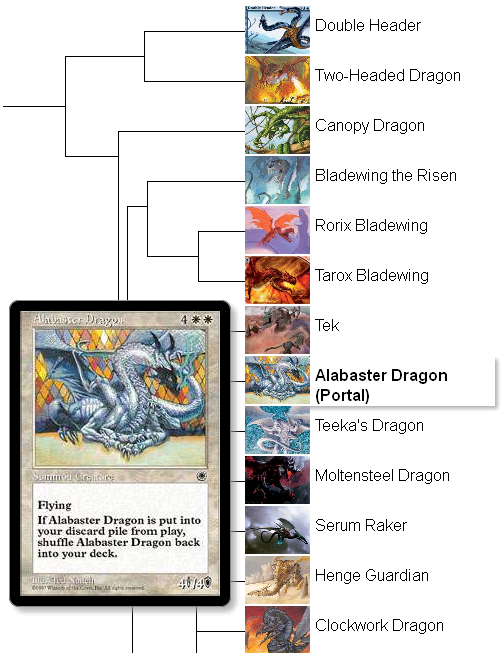
Back in 2005/6, we had some fun gathering and then writing up the results of clustering the dragons (and drakes!) from the game – Magic the Gathering, based on their appearance in the card illustrations. The clustering was done offline using data mining software and I put the resulting dendrogram image on the web with a little Javascript for interactivity.
Naturally a major goal of doing this new implementation was to shift the entire process to the web, so that we didn’t need to manually run the data mining software and update the report, and we also wanted an easy way of adding new dragons to the spreadsheet (since we did the original analysis, there have been 60 new dragons added to the game).
Here is the revised version with the new code which also shows the dragon images in the tree for easy perusal: Launch the dragon hierarchy.
The maths
I should really include some of the maths behind it, so here you go… though the choice of these particular methods is somewhat arbitrary.
Core concepts
- Mean of a feature: the average value of a feature across all the items (e.g. mean height over a set of people).
- Stddev of a feature: the standard deviation of values of a feature across all the items.
- Z-score of a particular feature of an item: a normalised version of that feature’s real value, calculated using the mean and stddev of that feature over the whole set of items. This is so we can more fairly compare features with different numerical ranges of values (e.g. height in mm vs number of siblings).
- Dot-product of a vector, “X.Y”. This is a way to multiply two vectors, or arrays. E.g. arrays with two elements each, [x1,x2].[y1,y2] = x1y1 + x2y2
Distance calculation
- Euclidean. This is the same as normal distance measurements – in a 2D plane, consider how you calculate the distance between two points – i.e. the length of the hypotenuse of a right-angled triangle. Extended to N-dimensions, where N is the number of features you’re looking at, this gives you the distance between two items taking into account all N of their features.
- Euclidean using normalised values (z-scores) instead of the actual feature values.
- Pearson’s correlation distance. This distance between two items is (1 – r), where r = Z(item1) . Z(item1) / N. (That’s a dot product of two feature vectors, divided by the number of features; Z(item1) is an array of the z-scores of all of item1’s features).
Cluster generation
Both of these methods start by joining items together into small clusters, and joining these further to build larger clusters and eventually a single tree.
The first step is to find the two ‘closest’ items and join them in a cluster. Then, you need to calculate the distance between this new cluster and all the remaining items. Then, repeat the process… find the two closest and join them, etc…
The difference in the methods below is in exactly how you calculate the distance between a cluster and an item, or between two clusters.
- Single Linkage: just find the items in the two clusters which are closest, and use the distance between them.
- WPGMA, weighted average linkage: this takes all the items in the cluster into account. I’m using this definition: “If cluster r was created by combining clusters p and q, the distance between r and another cluster s is defined as the average of the distance between p and s and the distance between q and s”.
So how good are the clusters?
This is the question, and I don’t have a definite answer, just some comments. (Because, as mentioned, I am not a mathematician.)
If you’ve played with the clusterer even a little bit, you’ll have noticed that the clusters you get can vary dramatically depending on which algorithms you’ve chosen for the distance method and cluster construction. They can change even more drastically if you change your input data: which features you choose to include, exactly how you measure/represent them in numbers, and how (or if) you apply any weighting. It’s very easy to tweak all these variables until you end up with a set of clusters you like the look of, or tell the particular story you want them to tell (we are certainly guilty of this in our fictional Dragon Clustering writeup).
But then, if you can make the clustering process produce whatever clusters you like, what real use is it?
If you are in a position where you already have some “ground truth”, i.e. you ‘know’ that some particular clusters should exist, you can then declare whether a result “looks right” or not based on that knowledge. If that one aspect of the clusters produced is verifiably correct, then, perhaps, the other aspects have a better chance of also being true/relevant to reality, or at least the parts of reality you’re interested in.
If you are entirely clueless to begin with, it is more difficult :) You might take a similar approach to the way long-term climate predictions are made: do lots of analyses, each with slightly different parameters, and see what happens most on average. If you try lots of variations and find that certain patterns of clusters keep popping up, maybe these relatively stable ones are more likely to have some bearing on reality. A variation of this is to repeat the clustering with different subsets of the input data.
The web as a database
The remainder of this post is web dev geekery :)
I wanted to make it easy to load up and even modify the data being clustered. As you will have seen if you’ve had a play, the clusterer can load data in CSV format (i.e. plain text, comma-separated) as long as it’s available at a public URL. This is how it is done.
For editing, any old spreadsheet or text editor will do, but Google Spreadsheets has the benefit of being online and shareable. It also, most conveniently, allows you to publish a spreadsheet as CSV. That gives you the CSV URL for the data without needing to mess around manually uploading the file somewhere. (The option is a little tricky to find: in the spreadsheet’s File menu, select “Publish to the web” and from there you can publish and get its CSV link.)
The next problem is to parse the CSV data so that the javascript can read and manipulate it. From previous experience, parsing CSV is no fun at all, so I was happy to use a service provided by Yahoo – YQL (Yahoo Query Language) – which, among many things, can convert from CSV to JSON (a format which Javascript can easily read, JavaScript Object Notation). This YQL service can be used by constructing a URL which looks like:
http://query.yahooapis.com/v1/public/yql?q=select * from csv where url=’http://url.to/my.csv‘&format=json&callback=yqlGoogCallback


This URL produces a text file containing javascript, which can be loaded into your page with a <script> element as normal. Once Yahoo’s javascript has been loaded it calls the function yqlGoogCallback, which it assumes you have already defined in your page, and which can do whatever you like with the nicely parsed data – in my case, the function loads the data into the clusterer, calculates the clusters and displays the results.

So, with the help of both Google and Yahoo, the javascript clusterer can read the data ‘directly’ from a live Google spreadsheet (or any other CSV file on the web). You can create, edit, cluster, and display your data all in a web browser. This makes me very happy.
Google spreadsheet -> CSV -> YQL parses CSV -> JSON -> JS clusters and displays
(By the way, it is also possible to get JSON directly from Google spreadsheets, but this takes a bit more parsing as the structure is rather awkward. You could also trick the spreadsheet into inadvertently outputting JSON, but that’s rather messy (although clever). I went for the YQL option because it was cleaner and would work with any CSV URL, although it does add a dependency.)
Web Workers
It turns out the clustering is a little demanding on the web browser: it takes 2-3 seconds for me in Firefox, Chrome, Opera, and Safari, and IE8 just isn’t having it (it pops up ‘slow script’ warnings).
I haven’t tried optimising the code – instead, I decided to have a play with Web Workers, an HTML5 feature that’s been supported for a while by all the usual suspects (so IE users have to wait for version 10). They’re also not available right now on Android/iphone browsers, due to performance concerns. Normally, if a page is busy running javascript, it isn’t able to respond to user interface requests (i.e. from you). Most browsers these days will pop up an alert telling you the page is running slowly and ask if you want to stop it; older browsers will just seize up until it’s finished (or give up the ghost). Web Workers allow you to run that troublesome script in a background thread instead, allowing the browser to stay responsive.
Web Workers are very easy to use in the browsers that support them. For the others, Michael suggested a fallback: run the script on the server instead. Server-side javascript is a real option these days with node.js, and Heroku conveniently offers free hosting for node.js projects. So, with only slight changes to the JS files used for the workers, I did this:
- Detect whether the browser supports web workers. (Modernizr is good for this and many other html5 things.)
- If it does, great. Start up a web worker in the browser to do the clustering calculations.
- If it doesn’t, fall back to server-side calculations. Instead of sending the input data to a web worker, AJAX POST it to a server-side version of the worker script on a node.js server.
- The result comes back (either from the web worker, or from the node.js AJAX response), and is handled in the browser to go on and render the dendrogram.
This works, although you then have to put up with IE8’s slowness in rendering the cluster tree itself, so I’m sure there’s still plenty of space for optimization ;)
I expect it would be possible to implement the web workers fallback more cleanly, so that you could use an identical .js for both in-browser and server-side workers. It would make a nice HTML5 polyfill. Probably someone’s already done it.
A brief note on the development process: Heroku runs a slightly old version of Node.js currently, so being lazy and not wanting to install that version on my machine, I instead used the Cloud9IDE (Mozilla Bespin in a past life) which lets you write and test the code on their server all within a browser – and then deploy it directly to Heroku. All very cloudy, and free for developing/small projects.
All dragon and card images © WOTC
Leave Your Comment